Energy and the Transition to a Net Zero 2050
The energy sector has been out of favour. Its weighting within the S&P500 has declined to below 3%, from a peak of over 15% in 2008. Despite this, the energy industry is still going to power the global economy for the coming decade and beyond through transitional fuels. The obvious need to reduce carbon emissions has required investors to view the industry critically.
Figure 1: S&P500 Energy Sector

Source: Topdown Charts, Datastream
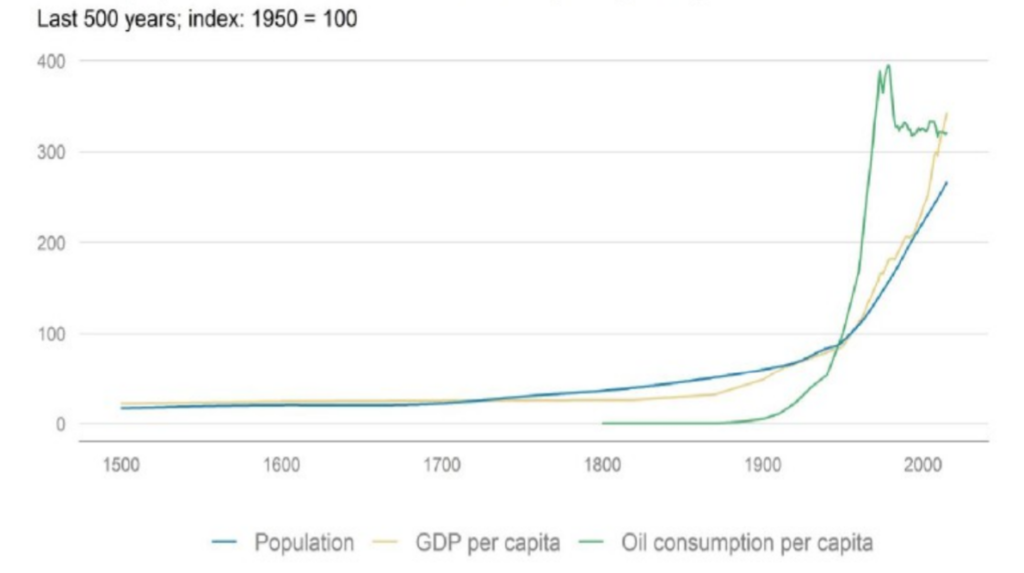
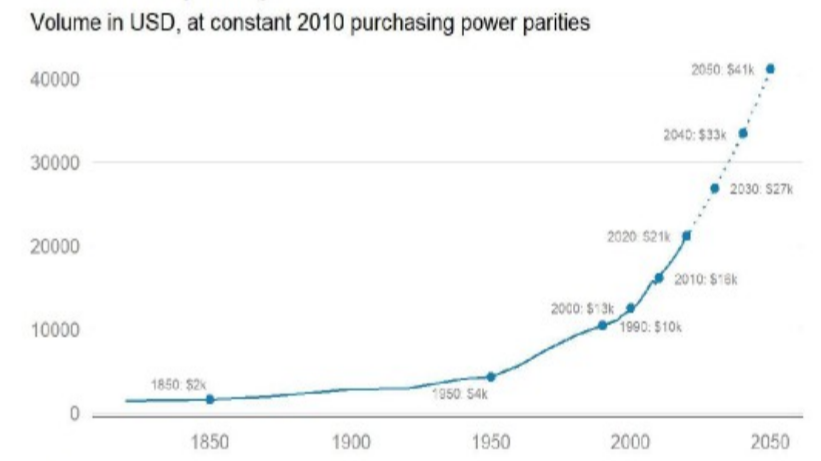
Historically, there is a positive relationship between rising income and energy consumption. As emerging economies continue to develop, the demand for energy will continue to rise.
Figure 2: Global population vs GDP and oil consumption per capita
Source: BP Statistical Review, Smil (2010), Our World in Data, The Maddison Project
Figure 3: Global GDP per capita
Source: The Maddison Project, OECD, Morgan Stanley Research
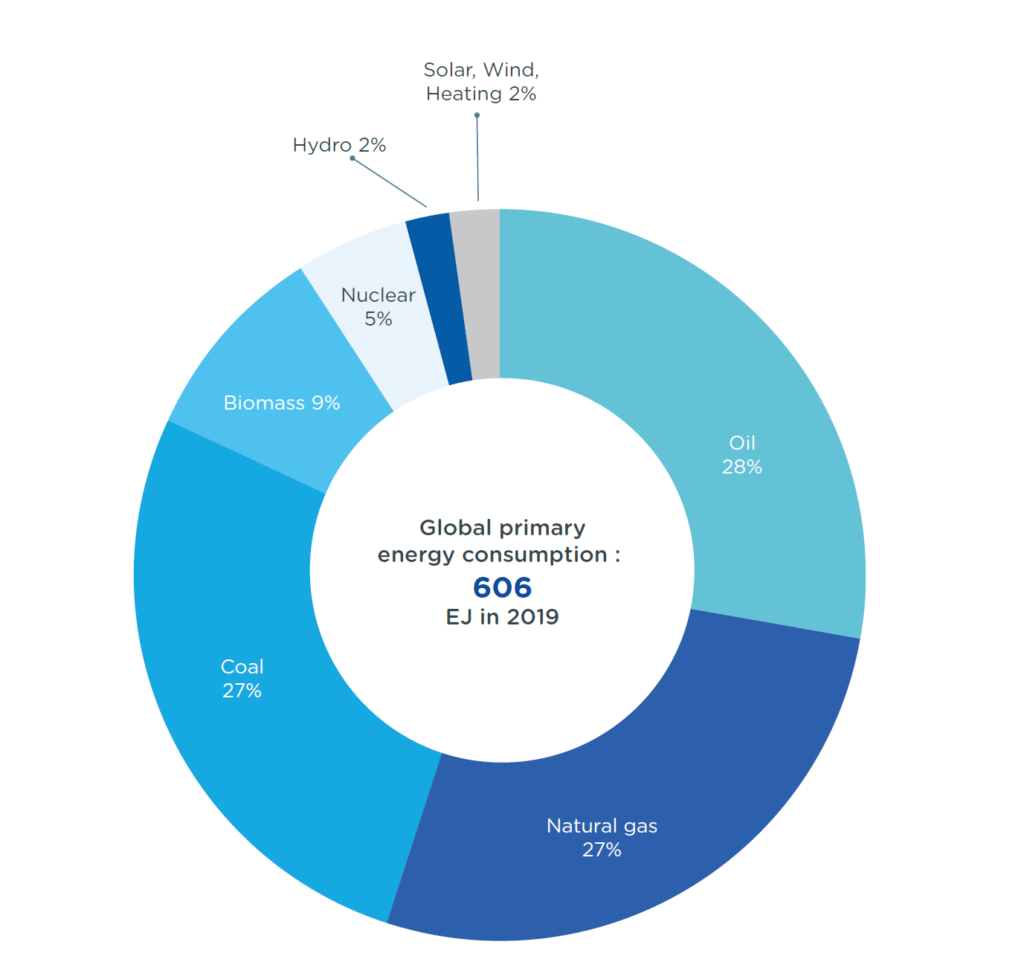
To meet the rising demand for energy and carbon emission reduction targets, countries and companies need to invest significantly in renewable energy sources such as solar, wind and hydro. The reality is that renewable energy accounts for less than 5% of energy needs. The transition to carbon zero is going to require the use of fossil fuels in years to come.
Figure 4: Overall energy consumption by primary energy source (in percent and EJ)
Source: IEA Key World Energy Statistics 2021
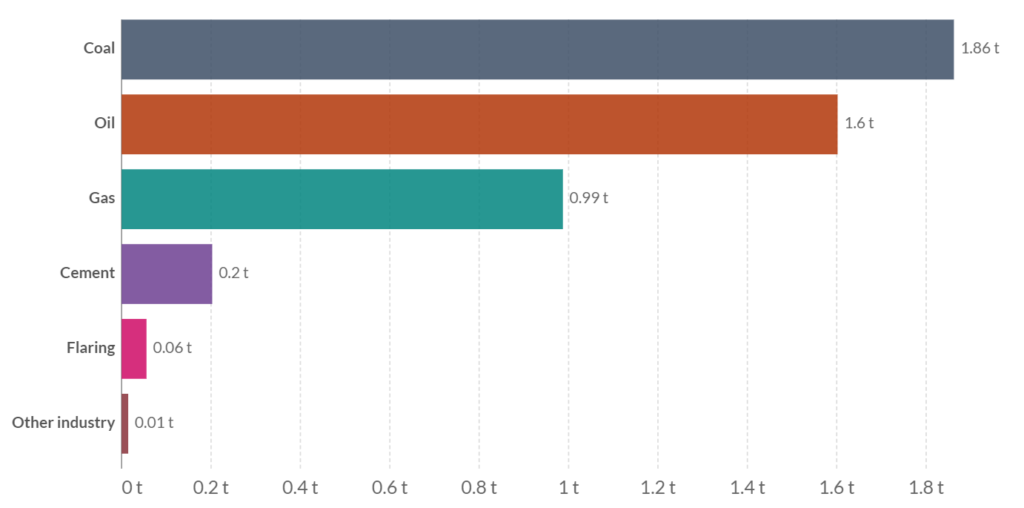
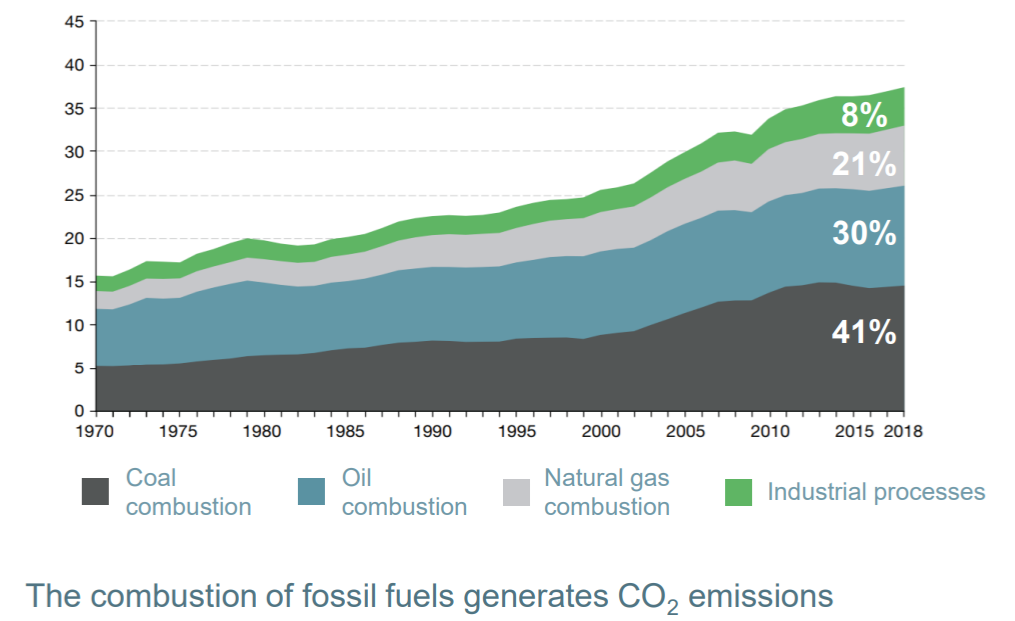
It is encouraging to know that our reliance on fossil fuels will reduce significantly over time. Coal, as the highest emitter of carbon, will come under the greatest pressure. Natural gas, dubbed “freedom gas”, produces the least carbon per unit of energy amongst the three primary fossil fuels and is the transition fuel of choice.
Figure 5: Per capita CO2 emissions by fuel type, World, 2019
Source: Our World in Data based on the Global Carbon Project
Figure 6: CO2 emissions by source in the world (in Gt CO2)
Source: Total Energies
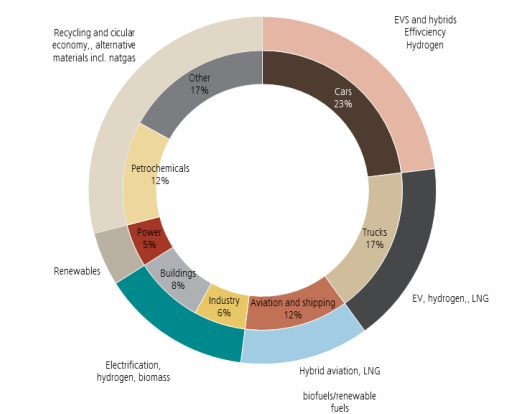
Oil is the second largest source of carbon emissions. The largest end-consumer of oil is the transportation sector, specifically passenger vehicles. This is followed by trucking, aviation, and shipping and then petrochemicals.
Figure 7: Breakdown of oil consumption
Source: UBS
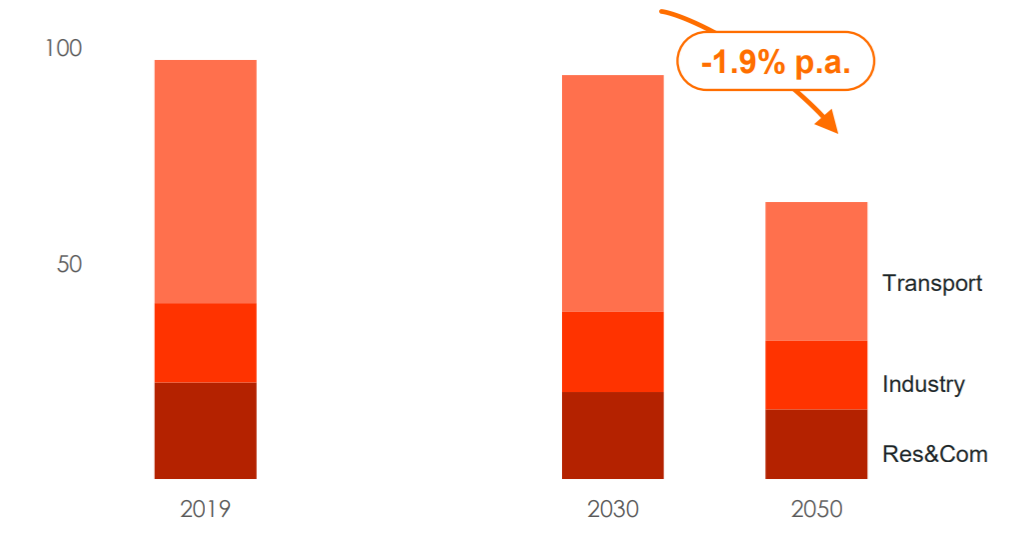
Despite excitement over electric vehicles (EVs), oil demand is expected to remain flattish through to 2030 and gradually decline after.
Figure 8: Oil demand by sector (Mb/d)
Source: Total Energies
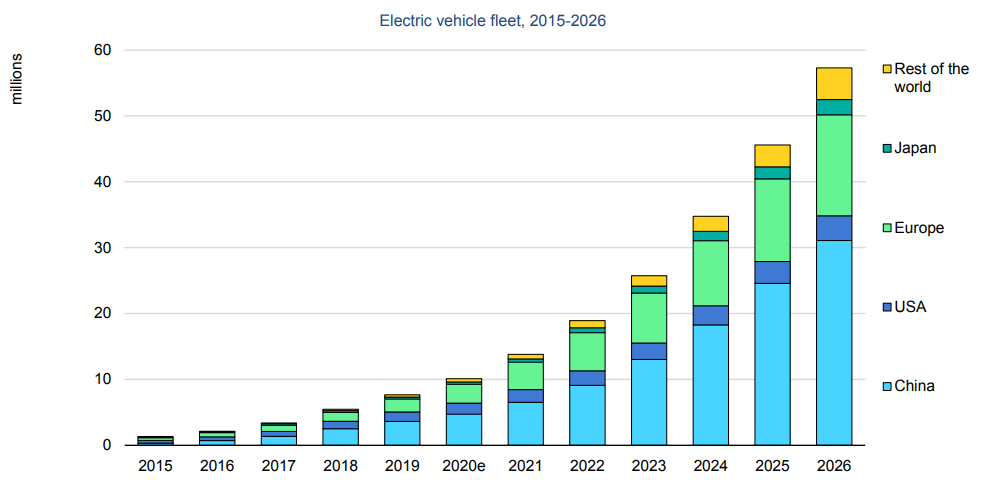
Governments around the world have adopted policies to reduce carbon emissions from the transportation sector. Many have mandated the phase out of internal combustion engine vehicles in the coming 10 years. However, this will take time. Only 10 million EVs were sold in 2020, representing around 10-12% of global car shipments. Additionally, there are over 1 billion cars on the road. Therefore, oil demand from the transportation sector will keep on growing as traditional vehicles continue to be bought, particularly in developing countries. Although EV sales will grow faster, the volume of vehicles to displace is still high.
Figure 9: Electric vehicles fleet should be close to 60 million in 2026
Source: IEA
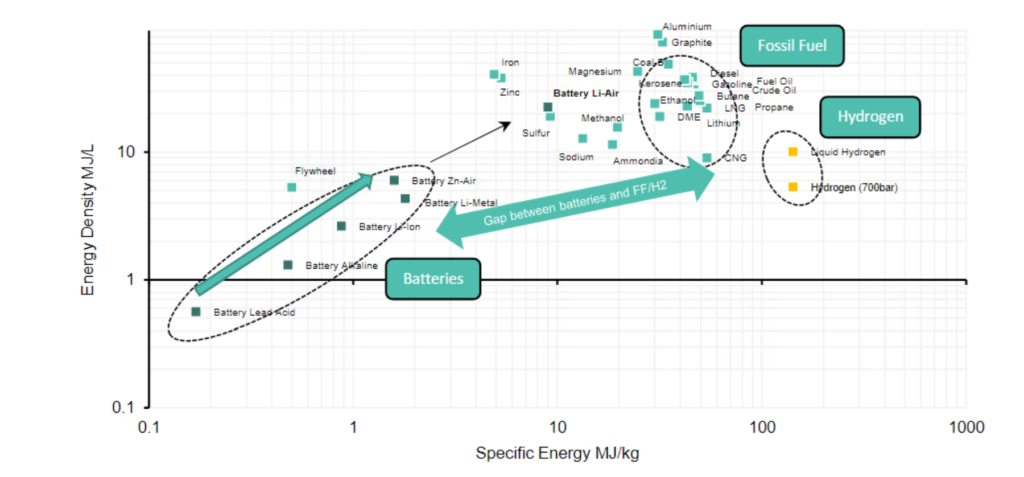
In the trucking, aviation, and shipping sectors, it is difficult for batteries to be widely deployed to replace normal engines. It is also quite unlikely for batteries to displace aviation fuel in jets, given the high energy density required and the weight of the batteries. Despite improvements in the energy density of batteries, it will not match that of fossil fuels or hydrogen in the medium-term future.
Figure 10: Energy density of batteries vs fossil fuels and hydrogen
Source: Bernstein
Demand for oil will not grow like it did in the previous decades, but there will be a baseline demand for oil that will be difficult to replace in the next 10 years.
So, where does it leave the oil industry? For quite some time, there has been a dividing line between the oil majors in Europe and the US. The oil majors in Europe have been more environmentally aware. They have given consideration and weight to environmental issues in corporate planning. In contrast, the oil majors in the US have had a different mindset. Environmental issues have not been top of mind until very recently. Fortunately, many are now beginning to make the necessary changes.
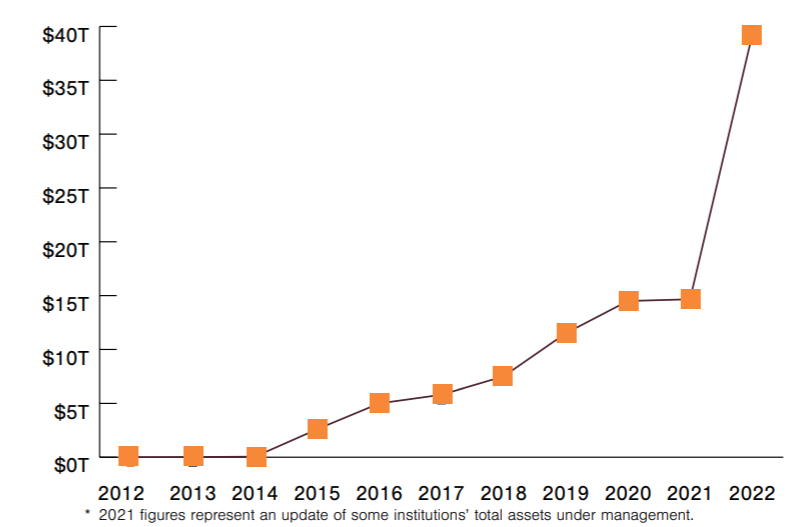
Investor activism and increasing difficulties in acquiring lending or financial support for their operations have led to greater environmental awareness. Funds under management committed to fossil fuel divestment has also grown rapidly.
Figure 11: Total assets under management committed to fossil fuel divestment
Source: Global Divestment Commitments Database
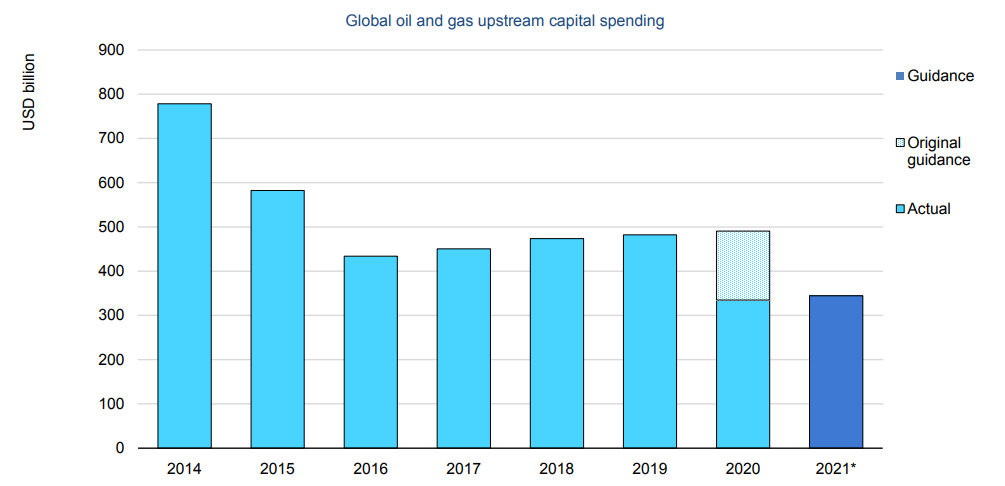
Even before the current wave of decarbonization, the oil industry had been curtailing capital spending following the last cycle peak in 2014.
Figure 12: Upstream spending plunged 30% in 2020 and will remain depressed in 2021
Source: IEA 2021
In view of years of under-investment by the oil industry, exacerbated by the COVID crunch and an extreme reluctance to grow capacity given carbon concerns, the industry may not be able to supply sufficient fuel as the global economy re-opens.
As an investor we need to ask ourselves how we can objectively assess the advantages and disadvantages of investment in the energy sector. We examined closely the strategies of Royal Dutch Shell (Shell), the largest oil major in Europe.
Shell has committed to reducing its absolute carbon emissions to zero by 2050. This includes Scope 1,2 and 3 emissions.
Figure 13: Shell’s commitment to net-zero by 2050

Source: Royal Dutch Shell
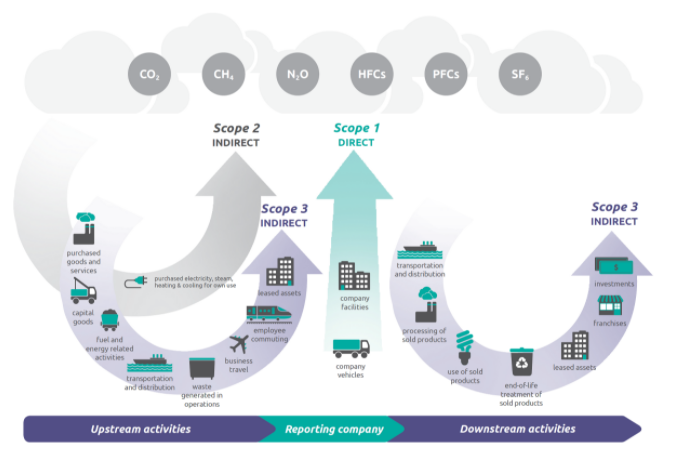
Scope 1 covers direct emissions that are generated from sources that are owned or controlled by Shell. Whereas Scope 2 covers indirect emissions associated with the purchase of electricity, steam, heat, or cooling. Although Scope 2 emissions physically occur at the facility where they are produced, they are included in Shell’s emissions as they are the result usage. Scope 3 includes full lifecycle emissions from energy sold by Shell. As an oil company, the inclusion of Scope 2 and 3 emissions in reporting is particularly notable.
Figure 14: Overview of Scope 1, 2 and 3 emissions
Source: EPA
Shell has formulated detailed plans to reach carbon zero and has committed to publishing an update every three years until 2050. They will also routinely seek an advisory vote from shareholders on their progress. Further, executive incentive plans have been redesigned to incorporate greater weighting towards energy transition performance benchmarks.
Figure 15: Shell’s long-term incentive plans for executives

Source: Royal Dutch Shell
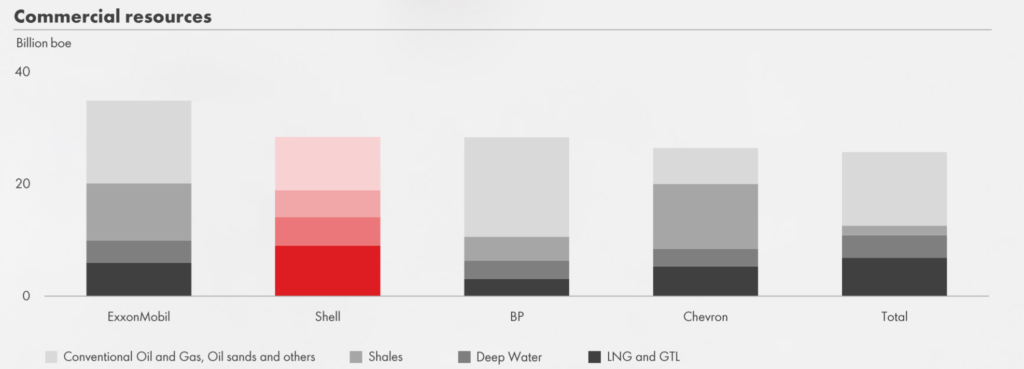
The Shell management mentality is no longer about finding and growing resources. Rather, it is seeking to let production decline gradually by investing extremely conservatively. This could be an important signal to the rest of the industry given that Shell has one of the largest commercial resources amongst the majors.
Figure 16: Commercial resources of major oil companies
Source: Royal Dutch Shell
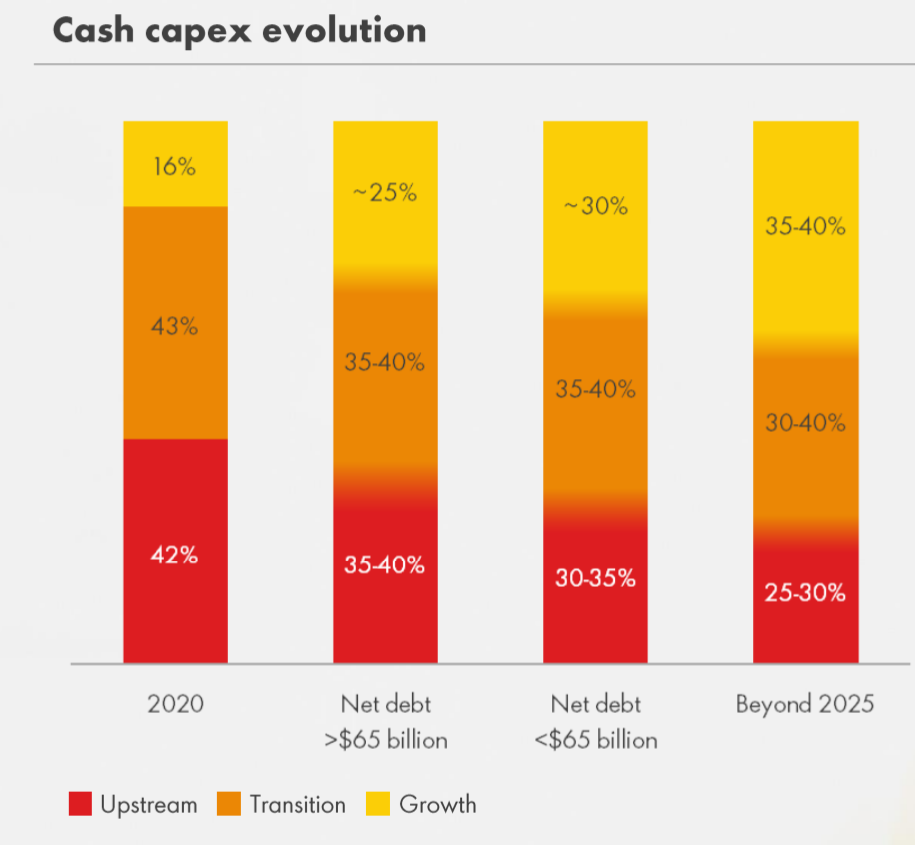
Traditional fossil fuel assets are a sunset industry. Shell plans to divert cash flow towards create businesses for the future and will invest around 40% of its cash flow into new green businesses with structural growth. It will also look to invest in its LNG franchise to help a smooth transition. There are few companies in the world with the financial strength to invest as much as $5 to $6 billion a year in environmentally enhancing projects.
Figure 17: Shell’s cash flow plans
Source: Royal Dutch Shell
Overall, Shell is well placed to help their customers transition to a low carbon world. It has the expertise, scale, infrastructure, and desire to support new and cleaner application technologies such as renewable hydrogen, offshore wind, biofuels, and carbon capture.
Oil demand will remain steady and natural gas will grow over the next few years. The better oil companies are drawing on their cash flow to build for the future and assist in the effort towards carbon zero.
There has been blanket condemnation of the oil industry by investors recently, flagging it as “un-investible” and not differentiating between those who are assisting with the transition and those who are not. However, the world still relies on fossil fuels for a substantial portion of its energy needs. Perhaps it’s better to source energy from a company who will work hard to reduce its emissions, rather than one who is purely profit driven.
This material has been prepared by Ox Capital Management Pty Ltd (ABN 60 648 887 914 AFSL 533828) (OxCap). It is general information only and is not intended to provide you with financial advice or take into account your objectives, financial situation or needs. To the extent permitted by law, no liability is accepted for any loss or damage as a result of any reliance on this information. Any projections are based on assumptions which we believe are reasonable but are subject to change and should not be relied upon. Past performance is not a reliable indicator of future performance. Neither any particular rate of return nor capital invested are guaranteed.
